Under review
Automatic evaluation using multimodal large language models (MLLMs), commonly referred to as MLLM-as-a-Judge, has been widely used to measure model performance. If such MLLM-as-a-Judge methods were biased, they could distort model comparisons and benchmark-driven scientific progress. However, it remains unclear to what extent MLLM-as-a-Judge methods favor or disfavor text generated by specific MLLMs. In this study, we propose Philautia-Eval to investigate such model-specific preference bias. Philautia-Eval quantifies the degree of the bias by disentangling preference tendencies from differences in generation quality. Using 1.29M caption-score pairs collected from 12 MLLMs, we found that representative MLLMs tend to exhibit self-preference bias. Moreover, experimental results indicate mutual preference bias within particular model families, which is potentially driven by reused connectors and overlapping instruction-tuning resources. Finally, we introduce a simple ensemble of MLLMs, Pomms. Our results demonstrated that Pomms effectively mitigated the model-specific preference bias while maintaining performance. Our project page and code are provided in the supplementary materials.
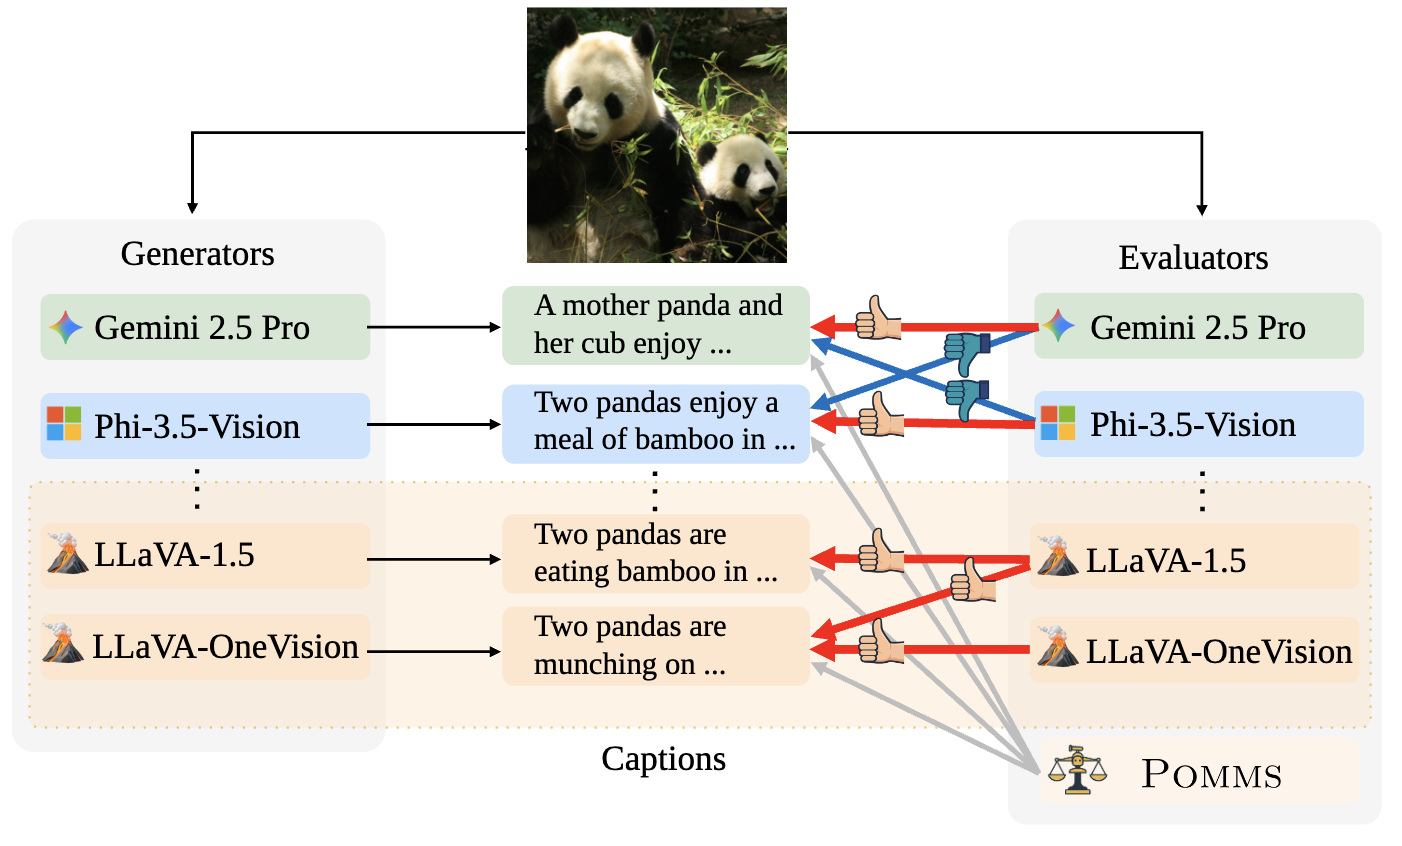
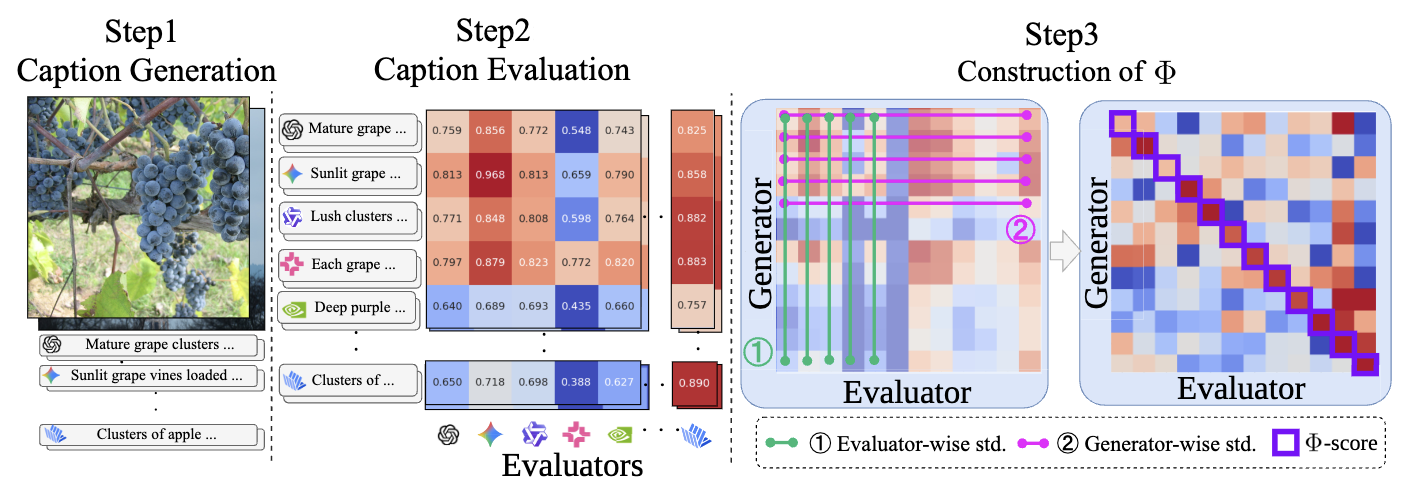
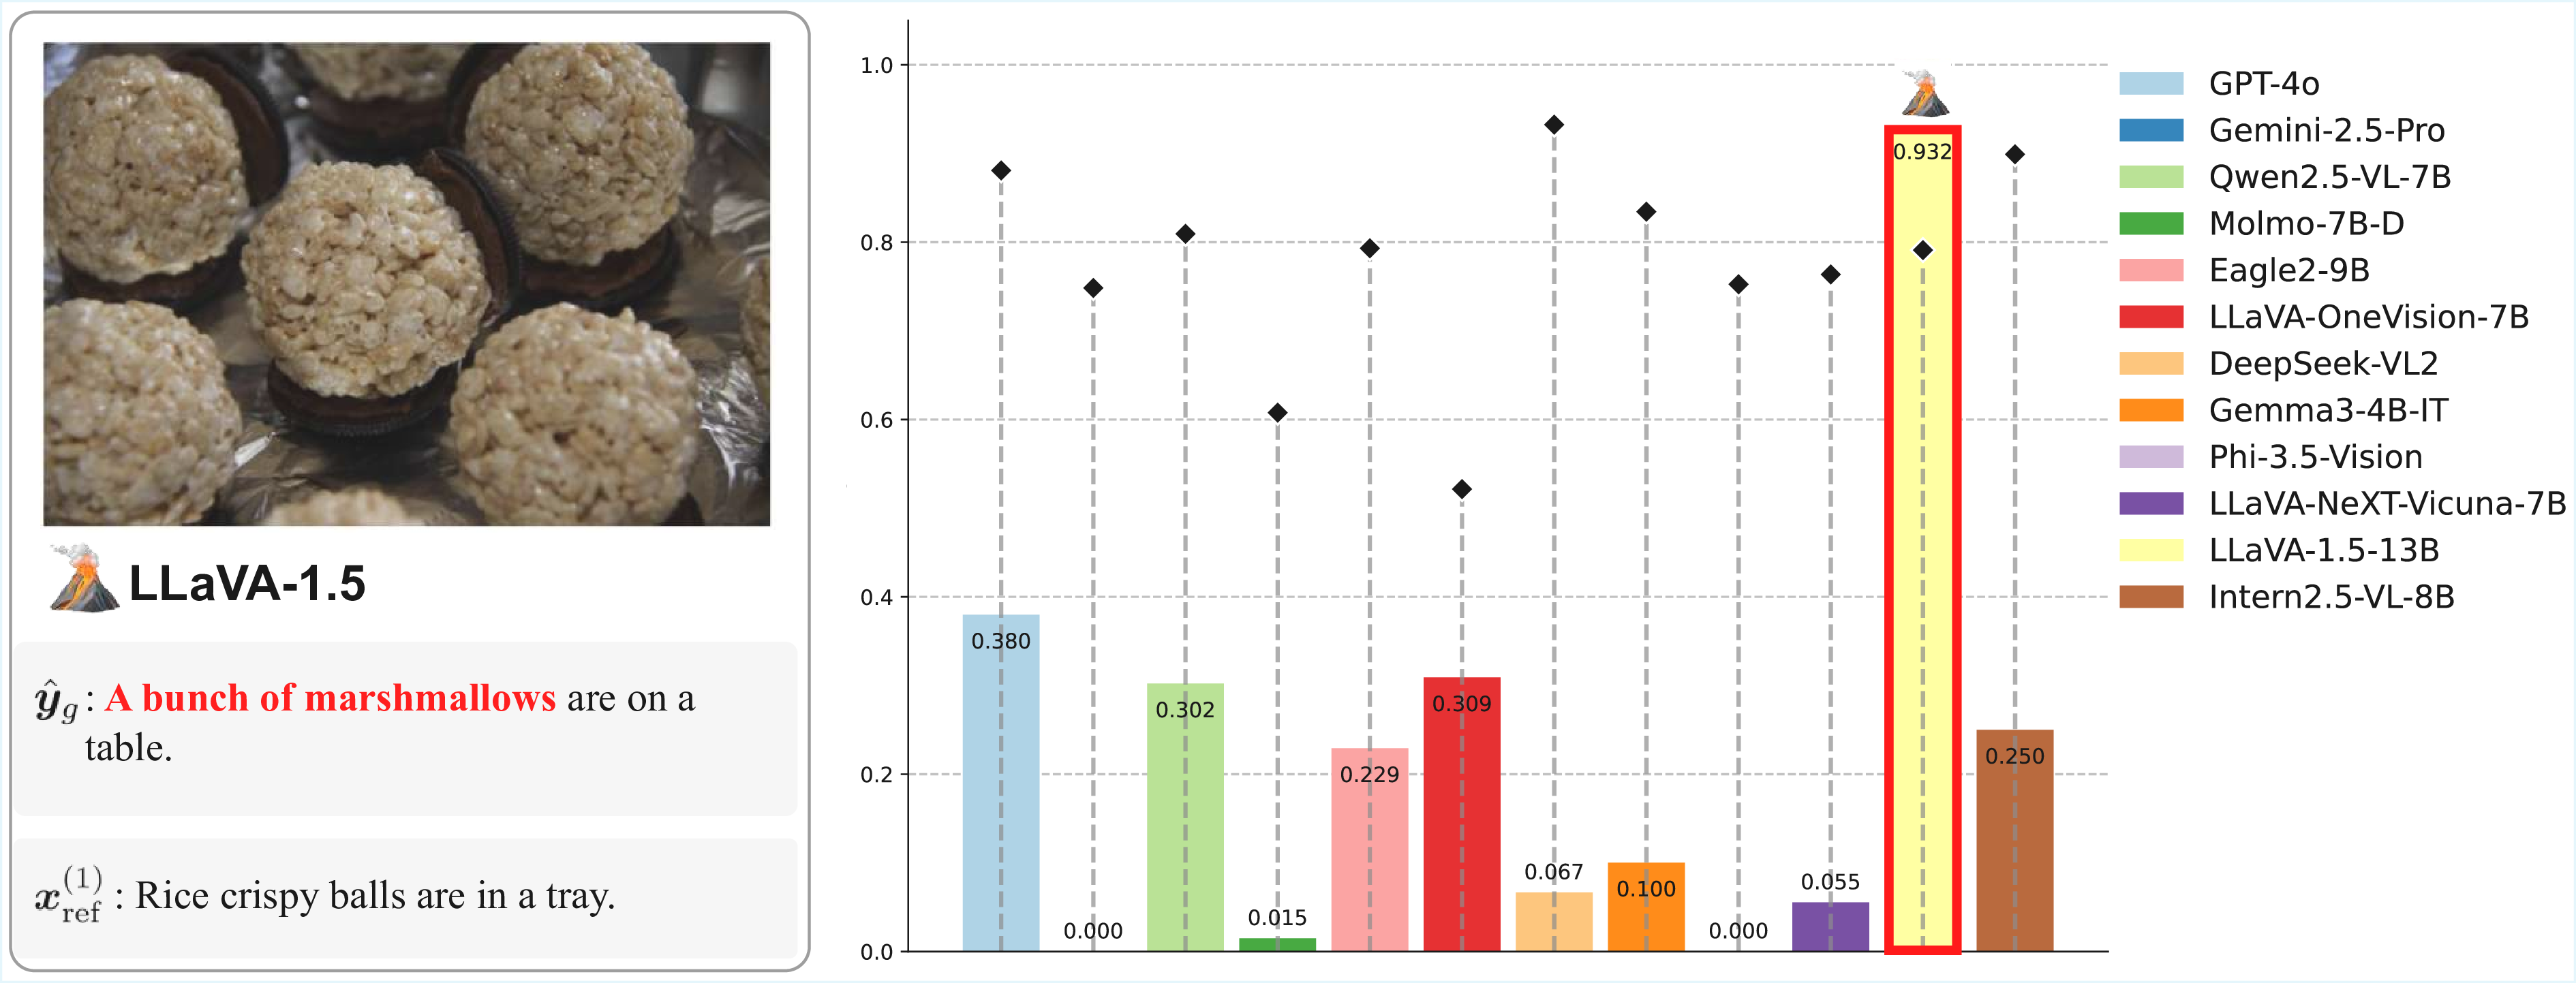
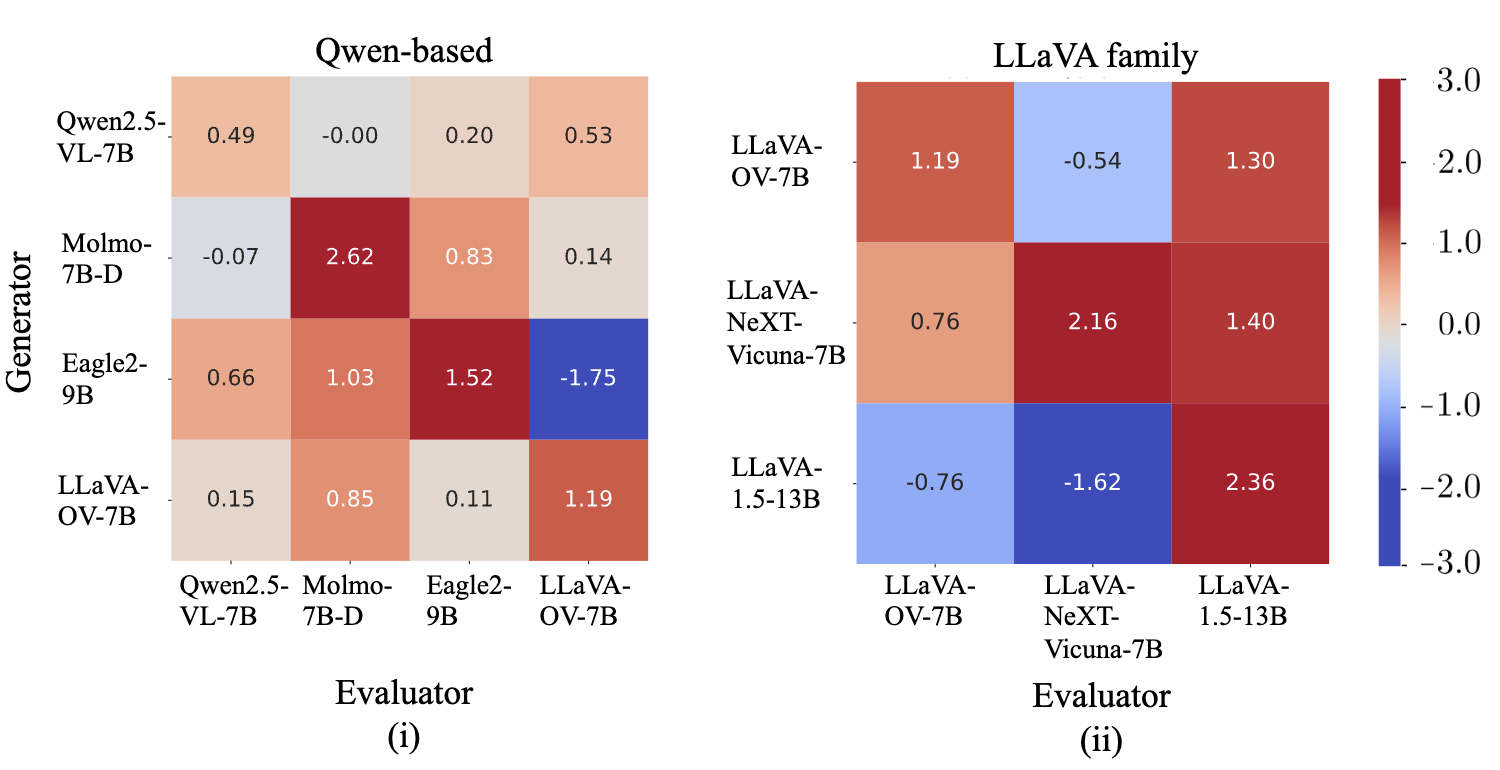
Schematic of our approach for investigating model-specific preference bias in MLLM-as-a-Judge. Each MLLM typically favors its own generations (self-preference bias), whereas LLaVA-1.5 favors text generated by other models within the LLaVA family (cross-model preference bias). Our Panel of MLLM Evaluators (Pomms) exhibits less model-specific preference bias.
Pipeline of the proposed method. Generators generate image captions, which are then given evaluation scores by Evaluators. From these scores, we construct a matrix \(\mathrm{\Phi}\), whose rows and columns correspond to the Generators and the Evaluators, respectively. We then standardize \(\mathrm{\Phi}\) column-wise and subsequently row-wise to obtain \(\tilde{\mathrm{\Phi}}\). The diagonal entries indicate the degree of self-preference bias, which we name the philautia score. In the figure, "std." stands for standardization.
Main findings:
Visualization of \(\tilde{\mathrm{\Phi}}\) in the (i) reference-based and (ii) reference-free settings. All philautia scores (diagonal items) were greater than zero, indicating the presence of self-preference bias within the MLLMs used in our experiments.
Main findings:
Visualization of preference bias within model families. (i) Submatrix for Qwen-based models: nine of the 12 off-diagonal entries were positive, suggesting a preference bias within the model family. (ii) Submatrix for LLaVA-family models: LLaVA-1.5-13B tends to favor its successor models (e.g., LLaVA-NeXT-Vicuna-7B, LLaVA-OneVision-7B).
Main findings:
| Metrics | Nebula | Flickr8k-Ex | SelfEval-Cap | |||
|---|---|---|---|---|---|---|
| \(\tau_b\) ↑ | \(\tau_c\) ↑ | \(\tau_b\) ↑ | \(\tau_c\) ↑ | Φ-score | ||
| G-VEval | GPT-4o | 56.1 | 53.2 | 61.5 | 59.7 | 1.08 |
| Qwen2.5-VL-7B | 55.3 | 52.4 | 54.6 | 54.0 | 1.12 | |
| InternVL2.5-8B | 54.1 | 51.3 | 54.6 | 52.9 | 3.03 | |
| Pomms | (i) GPT-4o and InternVL2.5-8B | 56.4 | 53.5 | 61.5 | 59.7 | 1.31 |
| (ii) + Eagle2-9B | 56.6 | 53.6 | 62.7 | 60.8 | 0.45 | |
| (iii) + LLaVA-OneVision-7B | 56.6 | 53.7 | 60.6 | 58.8 | -0.19 | |
| (iv) + DeepSeek-VL2 | 56.4 | 53.5 | 59.0 | 57.3 | 0.15 | |
| (v) + Qwen2.5-VL-7B | 57.0 | 54.1 | 59.6 | 57.8 | 0.52 | |
| (vi) + Phi-3.5-Vision | 57.0 | 54.1 | 59.6 | 57.8 | 0.42 | |
Quantitative comparison between Pomms and the baselines. For Pomms, each row sequentially adds a model to the ensemble. Bold font indicates the best results, and underlined font indicates the second-best results. "Φ-score" represents the philautia score.
| Evaluator | Generator | |||||||||||
|---|---|---|---|---|---|---|---|---|---|---|---|---|
| GPT-4o | Gemini-2.5-Pro | Qwen2.5-VL-7B | Molmo-7B-D | Eagle2-9B | LLaVA-OneVision-7B | DeepSeek-VL2 | Gemma3-4B-IT | Phi-3.5-Vision | LLaVA-NeXT-Vicuna-7B | LLaVA-1.5-13B | InternVL2.5-8B | |
| Self | 1.08 | 1.84 | 1.12 | 0.86 | 1.05 | 1.83 | 2.00 | 1.10 | 1.26 | 1.09 | 1.26 | 3.03 |
| Pomms | 0.23 | 0.18 | 0.67 | -0.26 | 0.01 | -0.90 | 0.67 | -0.33 | 0.11 | 0.14 | -0.18 | 0.34 |
Quantitative comparison between \(\tilde{\mathrm{\Phi}}_{E^{(i)}}(G^{(i)})\) and \(\tilde{\mathrm{\Phi}}_{\text{Pomms}}(G^{(i)})\). Bold font represents the best results.
Coming soon.